







































 Muhammad Jaffer

Do you also struggle to get a clear overview of your fundraising campaigns?
We understand the routine. You’re asked by someone how much a particular campaign raised last month, and you scrolled several pages searching, opening up spreadsheets, or worse. Or even doing some math in your head while they wait. It shouldn’t be that difficult to provide straightforward answers to questions about your own donation information.
That’s the demand our customers have for operating fundraising campaigns on WooCommerce. They received the donations, but deriving useful insights was like pulling teeth.
[product_banner index=’1′]
The new Dashboard look in Donation for WooCommerce actually tells you what’s going on with your campaigns.
Key Highlights of this Guide
- How eight summary boxes of the Donation for WooCommerce Dashboard give instant campaign insights with date filtering.
- Using timeline graphs to identify donation patterns and trends.
- Comparing campaign performance through visual bar charts.
- Filtering and sorting detailed campaign data without exports.
- Managing everything from one unified dashboard interface.
What You Get When You Open the Dashboard
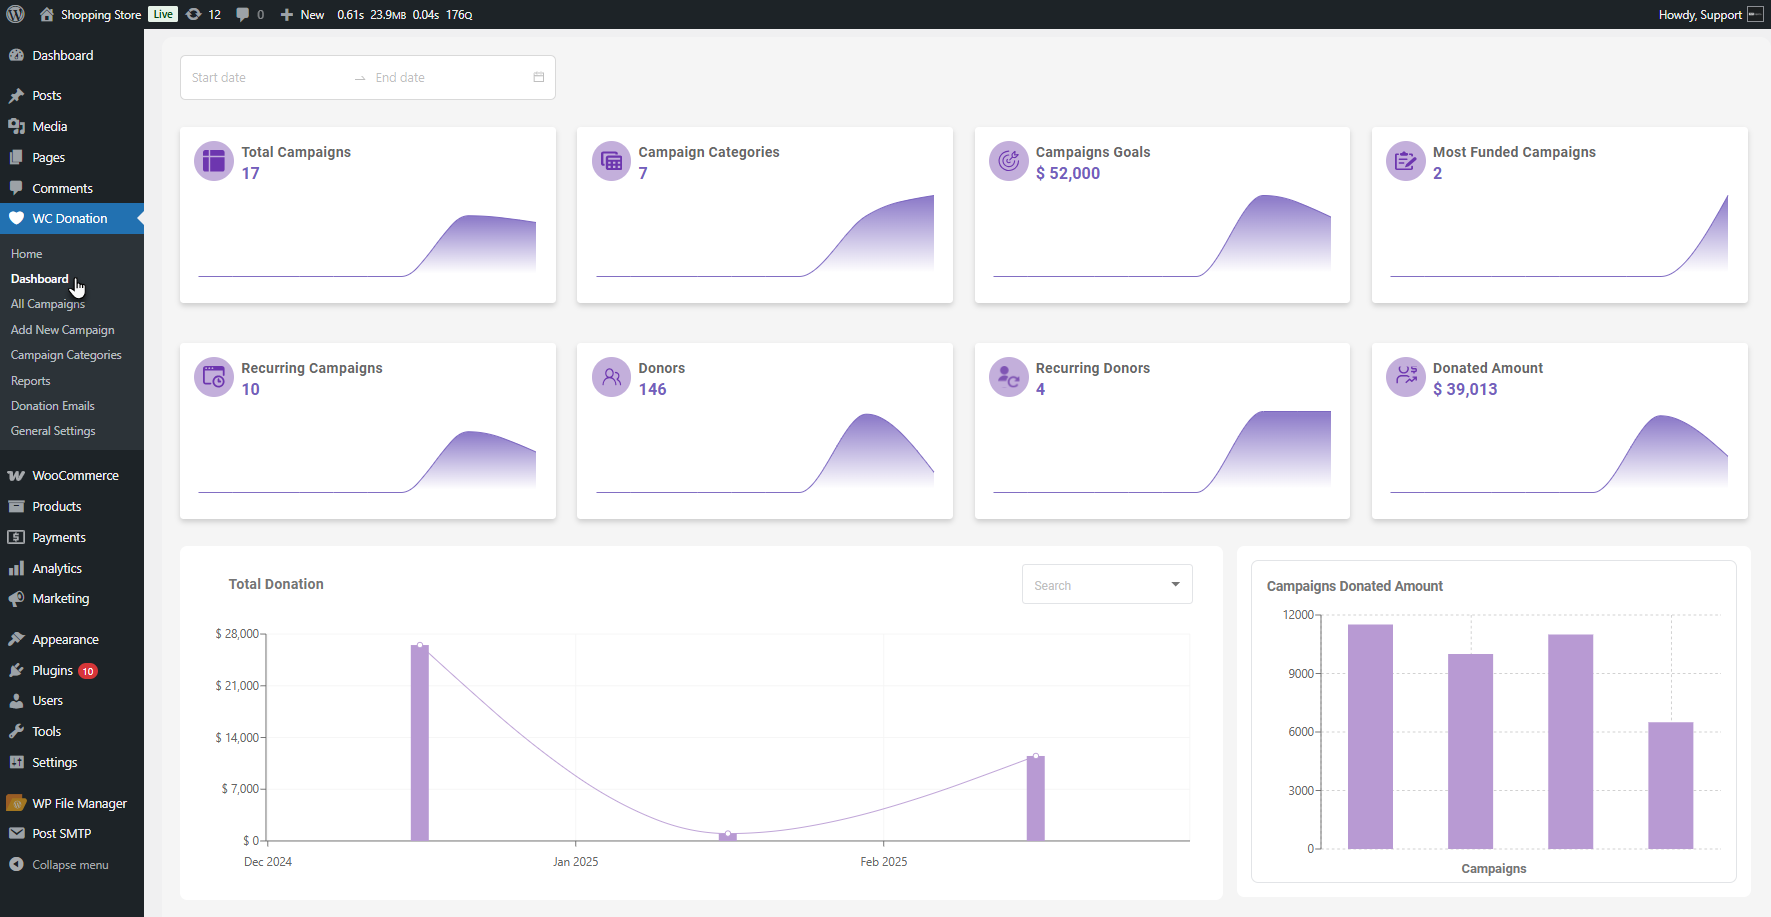
Go to WordPress Admin Dashboard, then WC Donation, then Dashboard. That’s it. It all loads up, and you can see what’s happening.
We divide it into four big sections. Each one answers different questions you might ask yourself every day.
Those 8 Boxes at the Top
Eight boxes appear at the top of the dashboard. Each one of them tells you something specific about your campaigns.
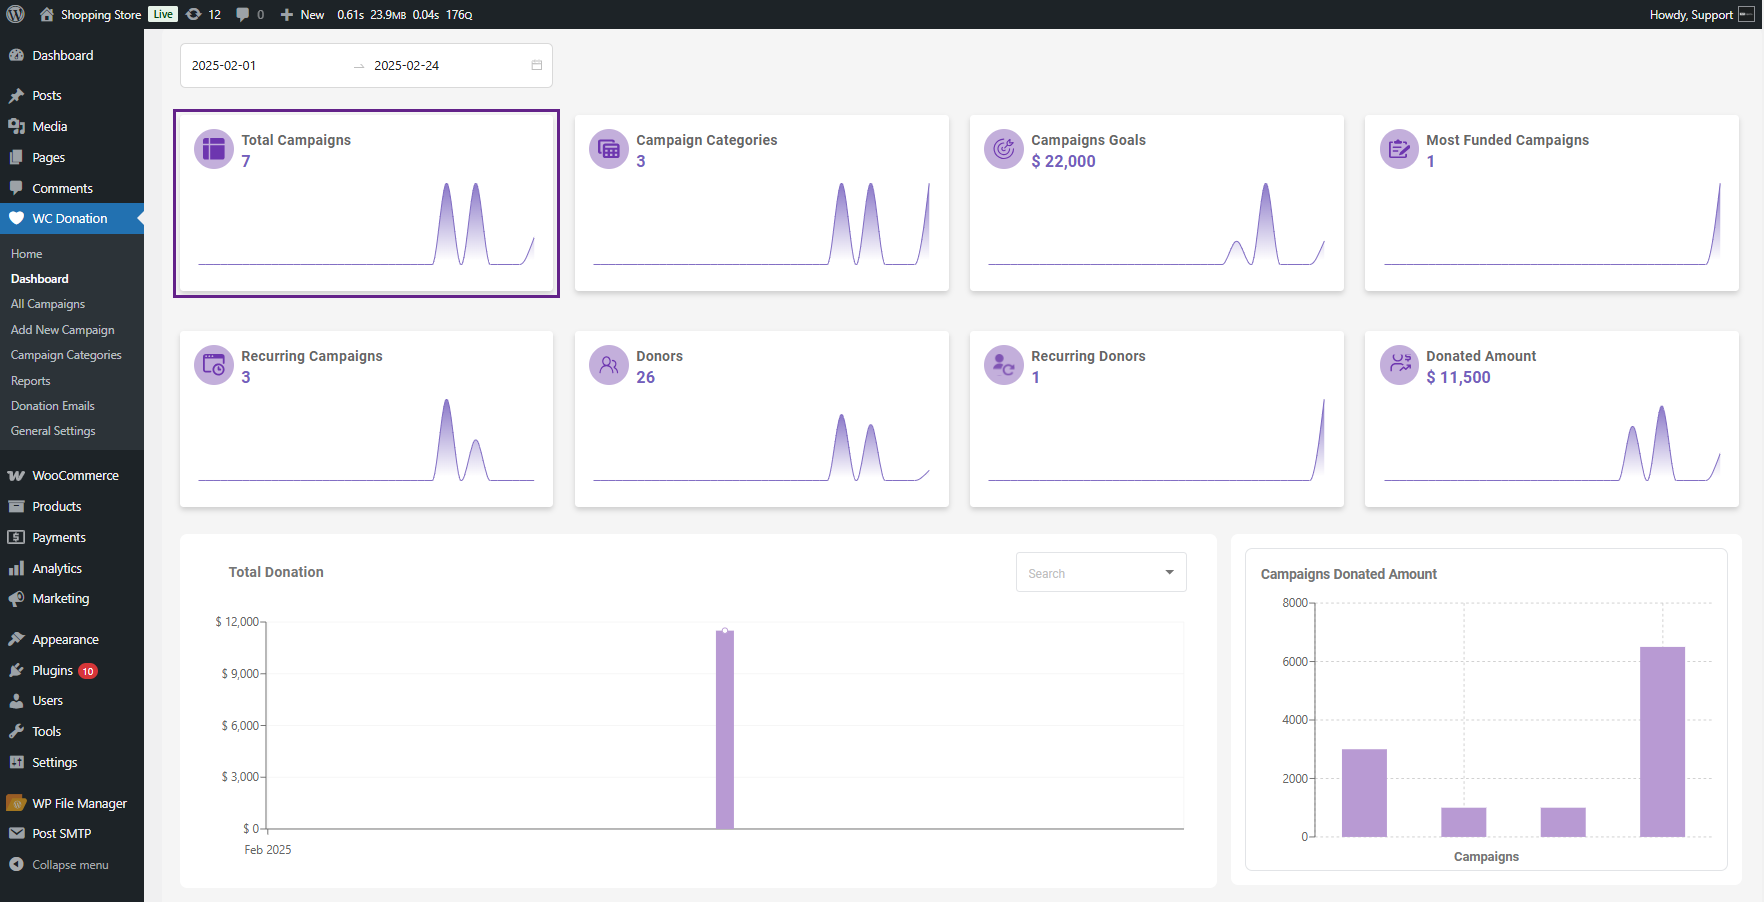
1. Total Campaigns
It indicates how many campaigns actually have orders. Not how many you made—how many gave. If you just hover over any point, you can tell what happened on that particular date. It comes in handy when you’re trying to recall whether or not that email blast actually worked.
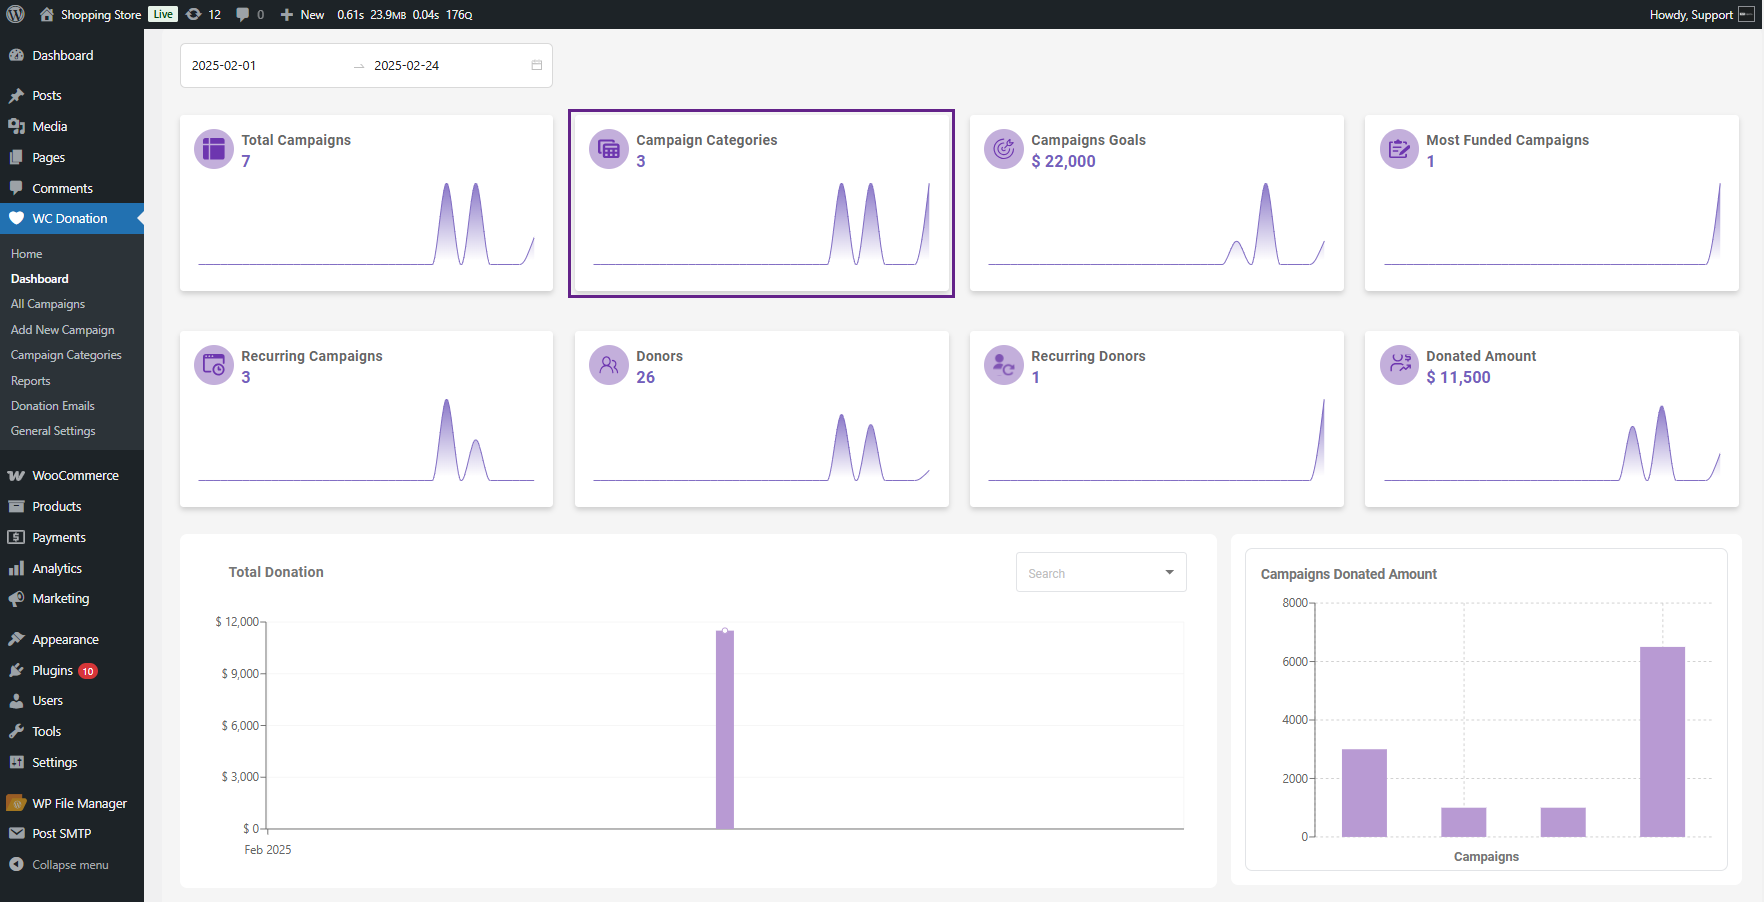
2. Campaign Categories
It counts up the categories where orders were received. This is useful if you categorize campaigns and wish to know which are profitable.
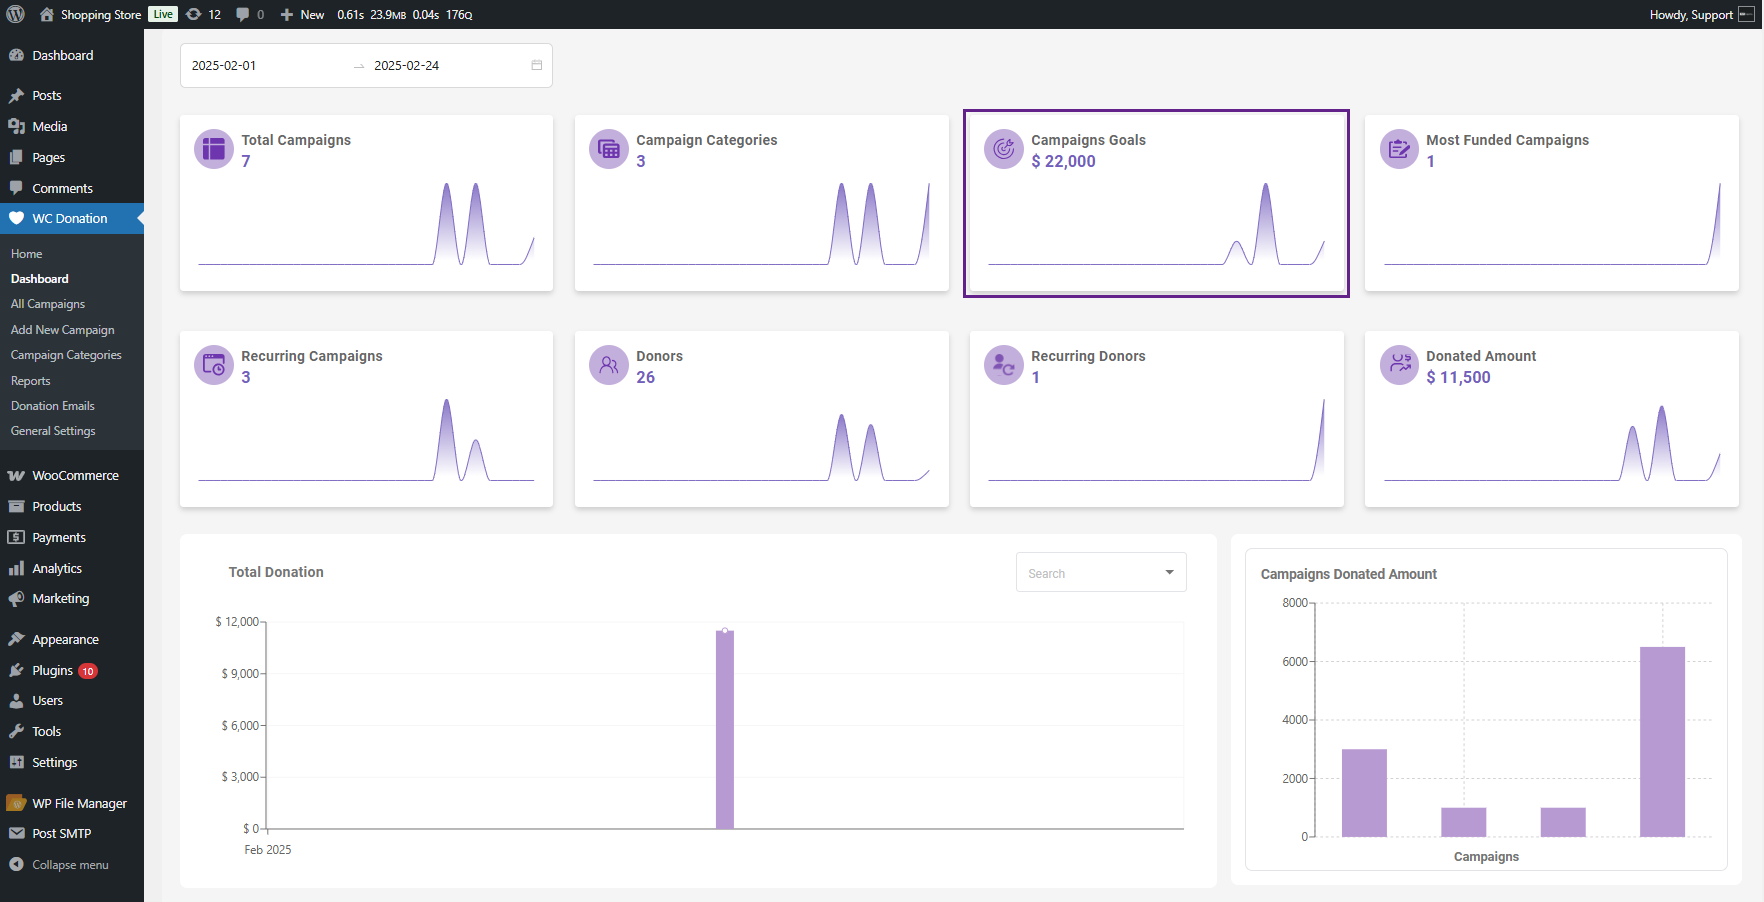
3. Campaign Goals
It displays the total financial targets for all your campaigns. It’s your overall dream number.
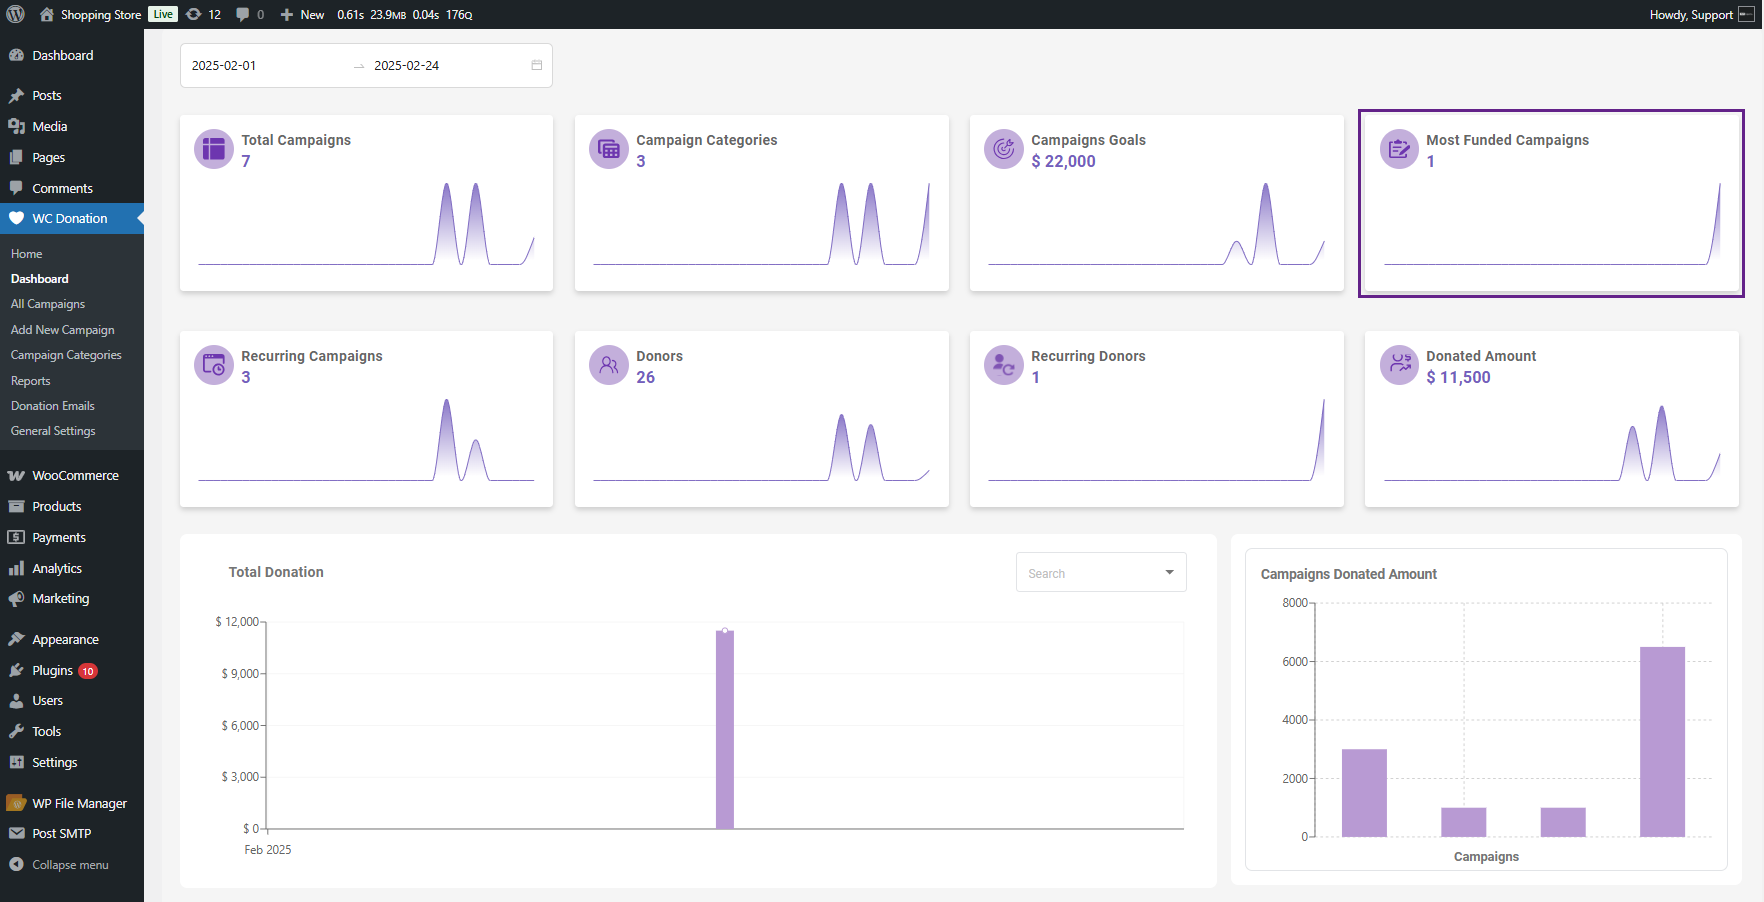
4. Most Funded Campaigns
This section is actually a cool one. It only includes campaigns that reached 75% of their target. So you’re looking at which ones actually had a shot at it. Not all campaigns you ever ran—just the ones that have real traction.
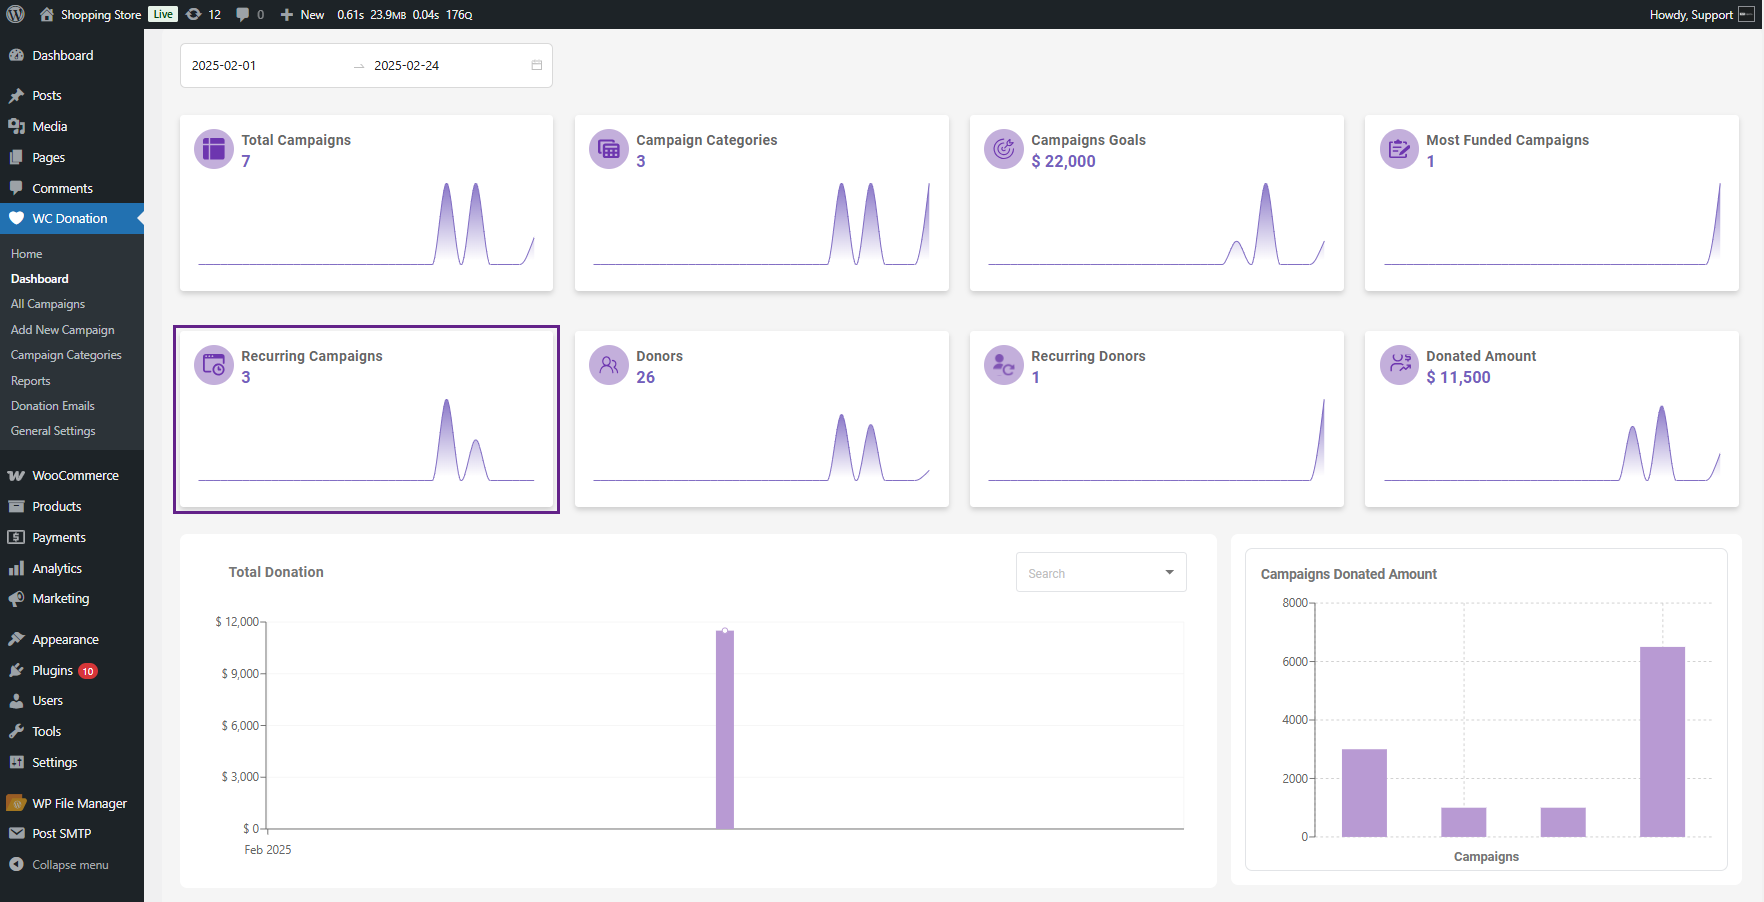
5. Recurring Campaigns
This section displays a list of campaigns that offer recurring donation options to your customers. We deliver this tab to count your regular monthly donations separately from one-time gifts.
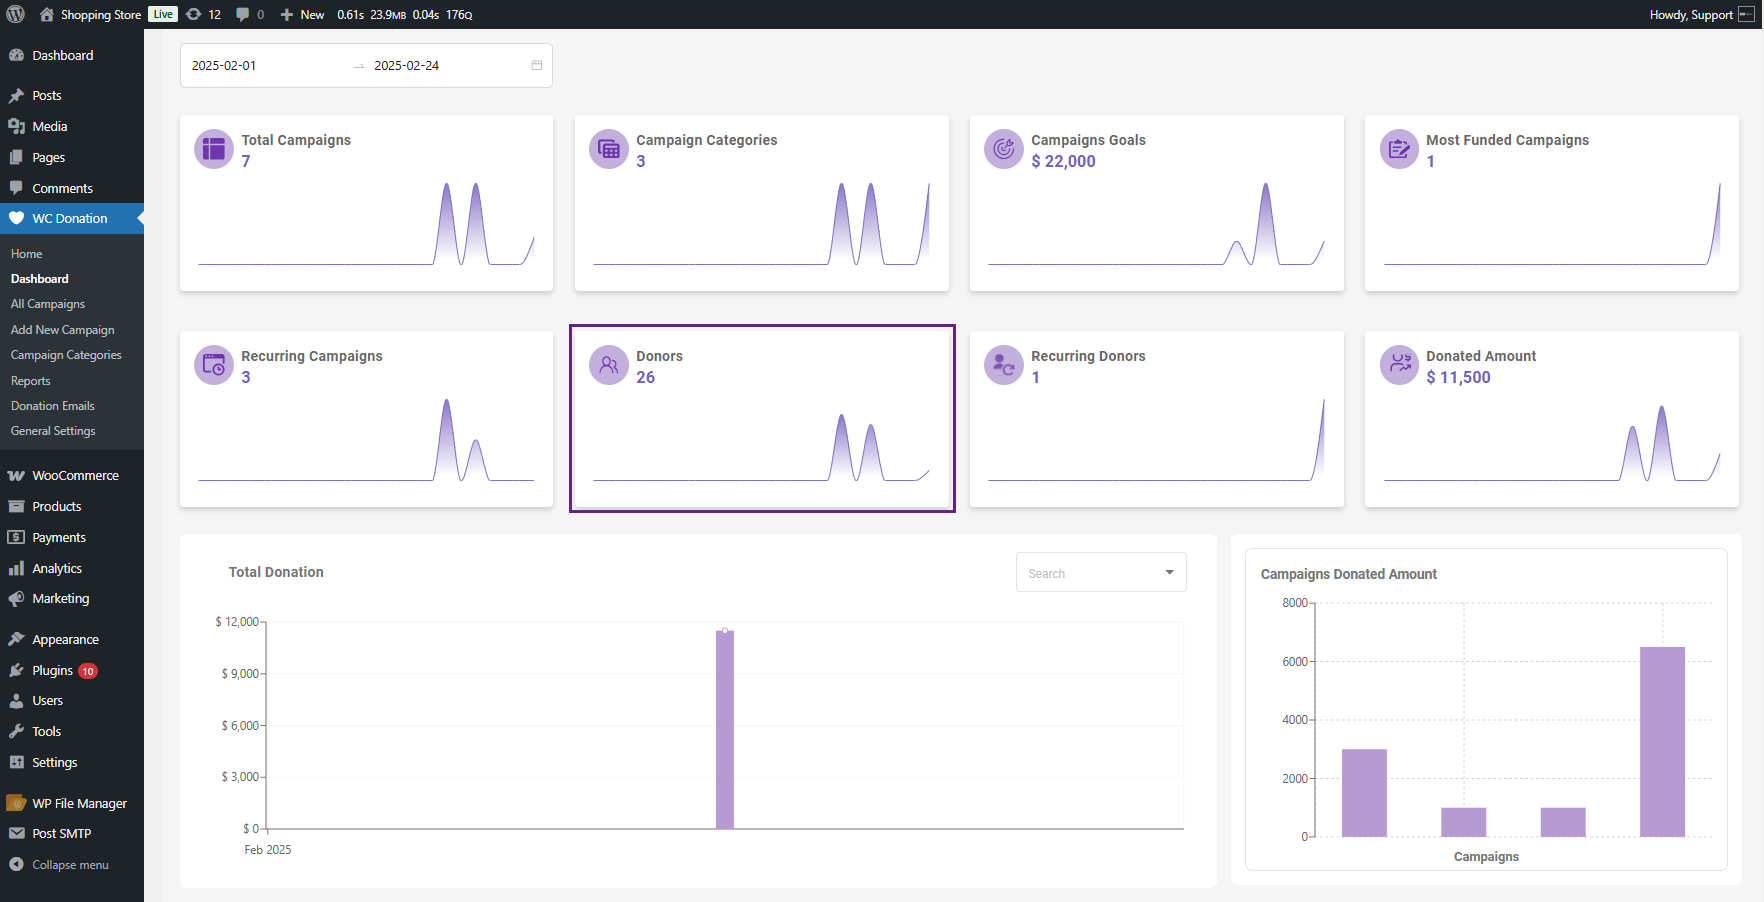
6. Donors
This tab informs you how many individuals contributed across all of it. Real individuals, not merely transaction totals.
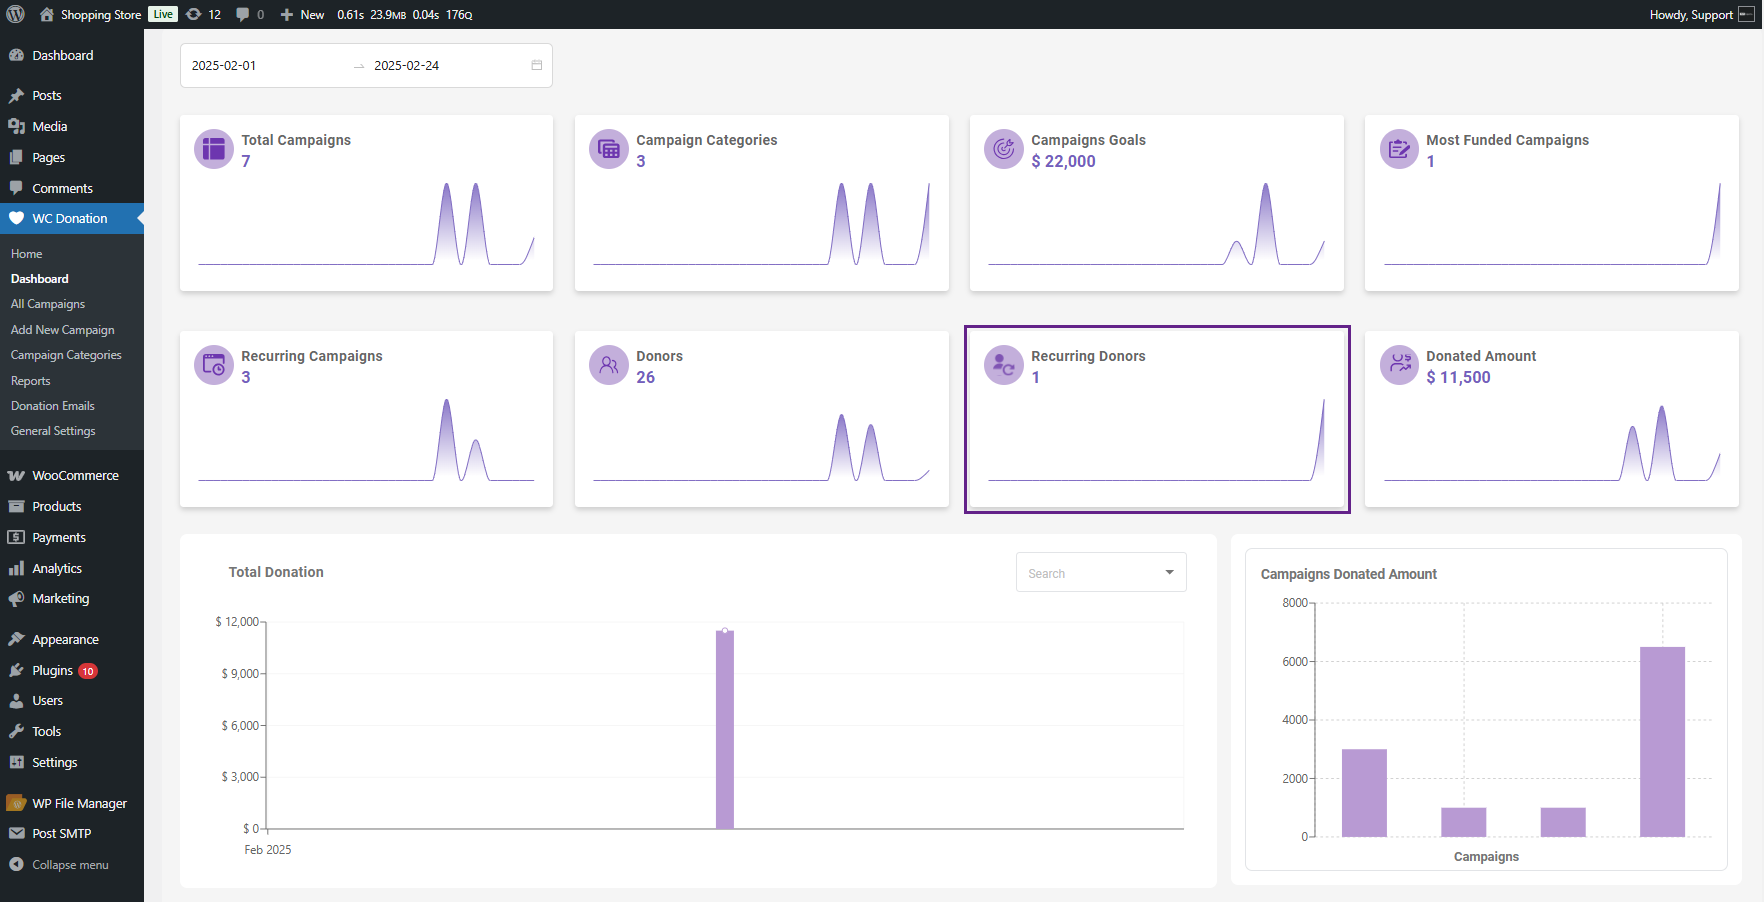
7. Recurring Donors
Actually, it counts people who donate multiple times. These individuals are gold for any organization. They’re worth learning about on their own.
8. Donated Amount
The amount you received as a donation is quite substantial. Total dollars contributed across all campaigns—the figure everyone wants to know.
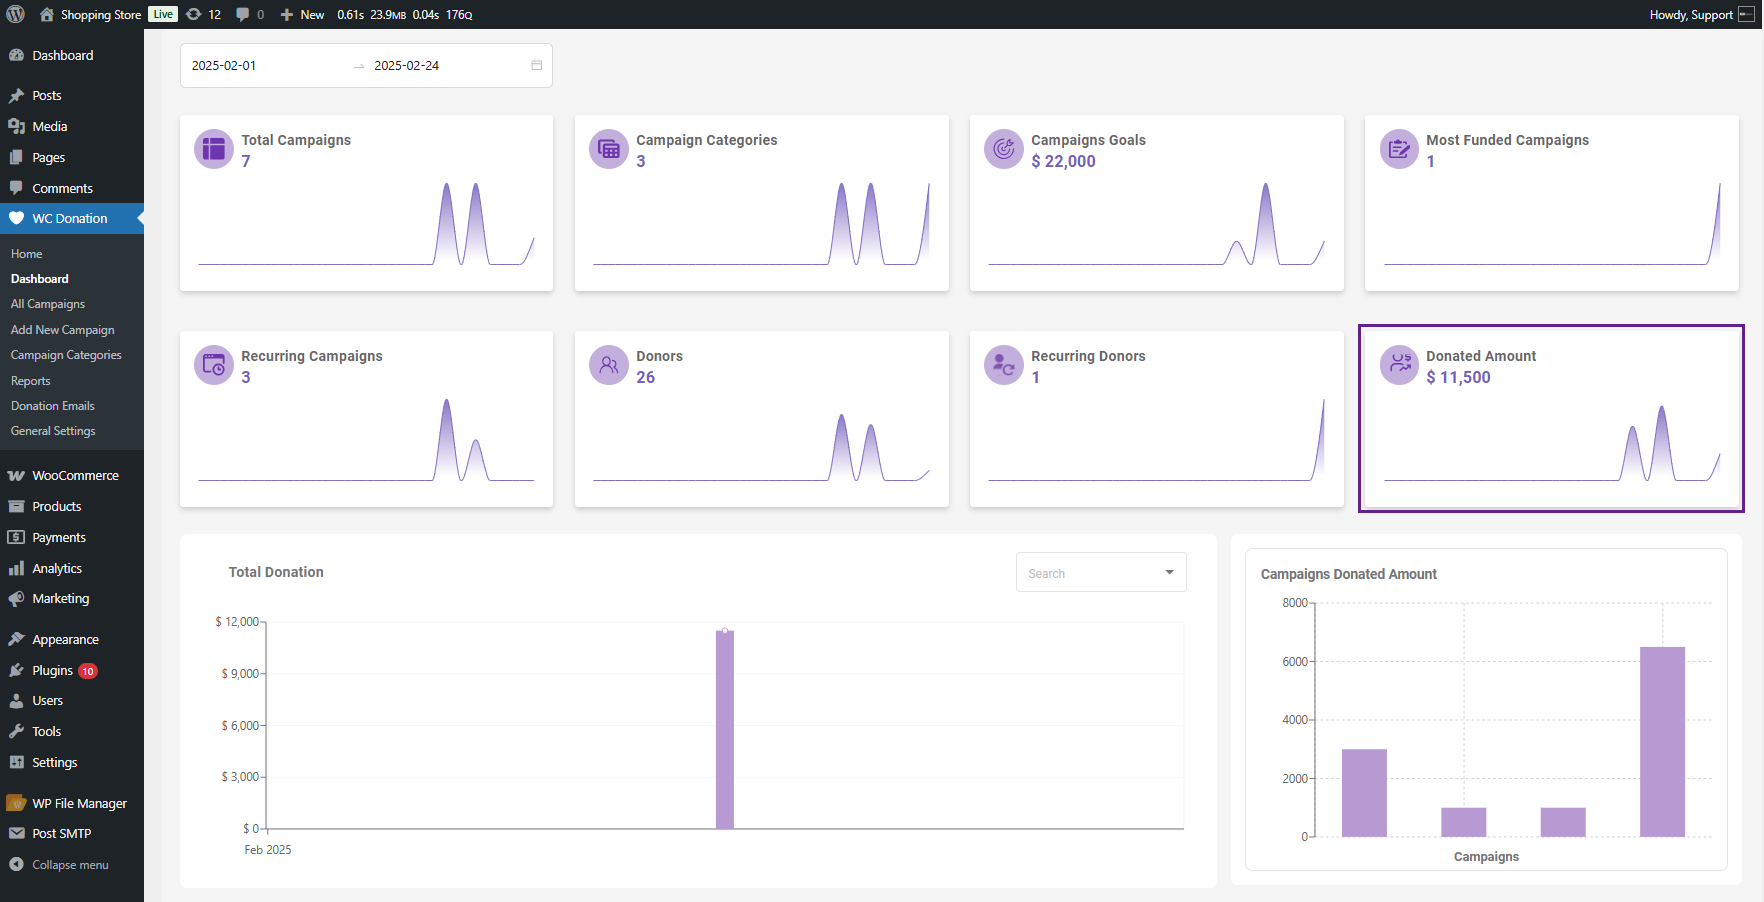
Here’s why these boxes become truly helpful: you can filter by date range, and everything updates. Want to view only September? No problem. Compare this quarter to last quarter? Two seconds. The boxes recompute for whatever time frame you select.
[product_banner index=’1′]
The Timeline Graph Shows You When Money Came In
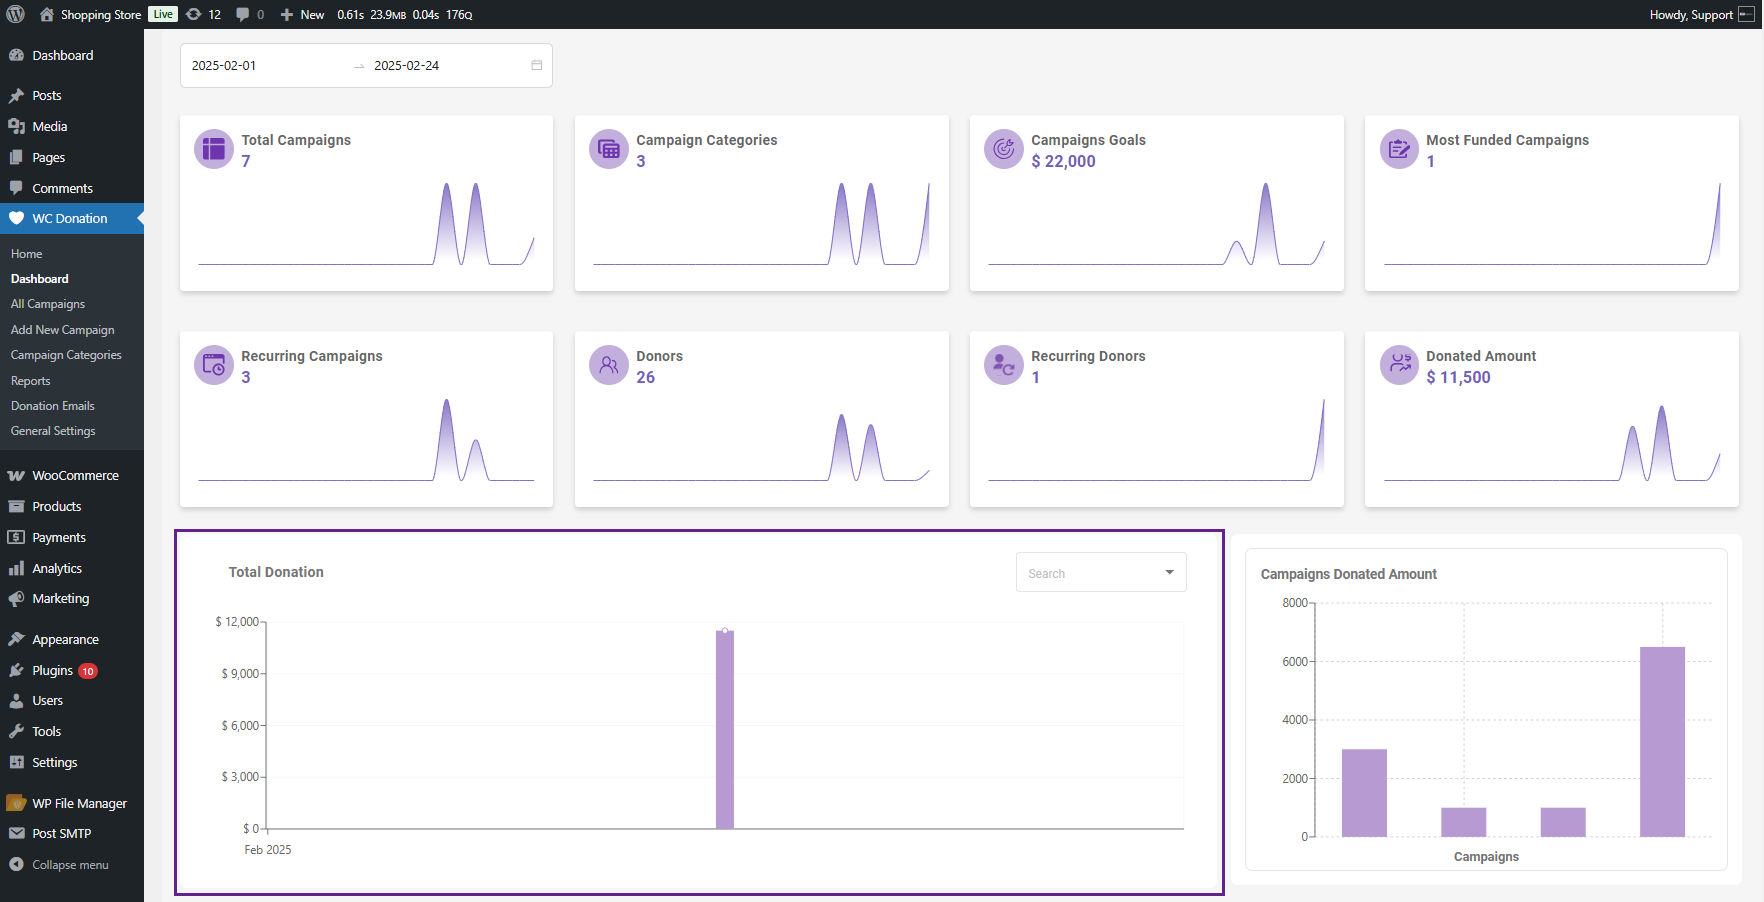
Underneath those summary boxes, there’s a graph that trends donations over time. You select your date range, and it indicates the stream of donations day by day or week by week.
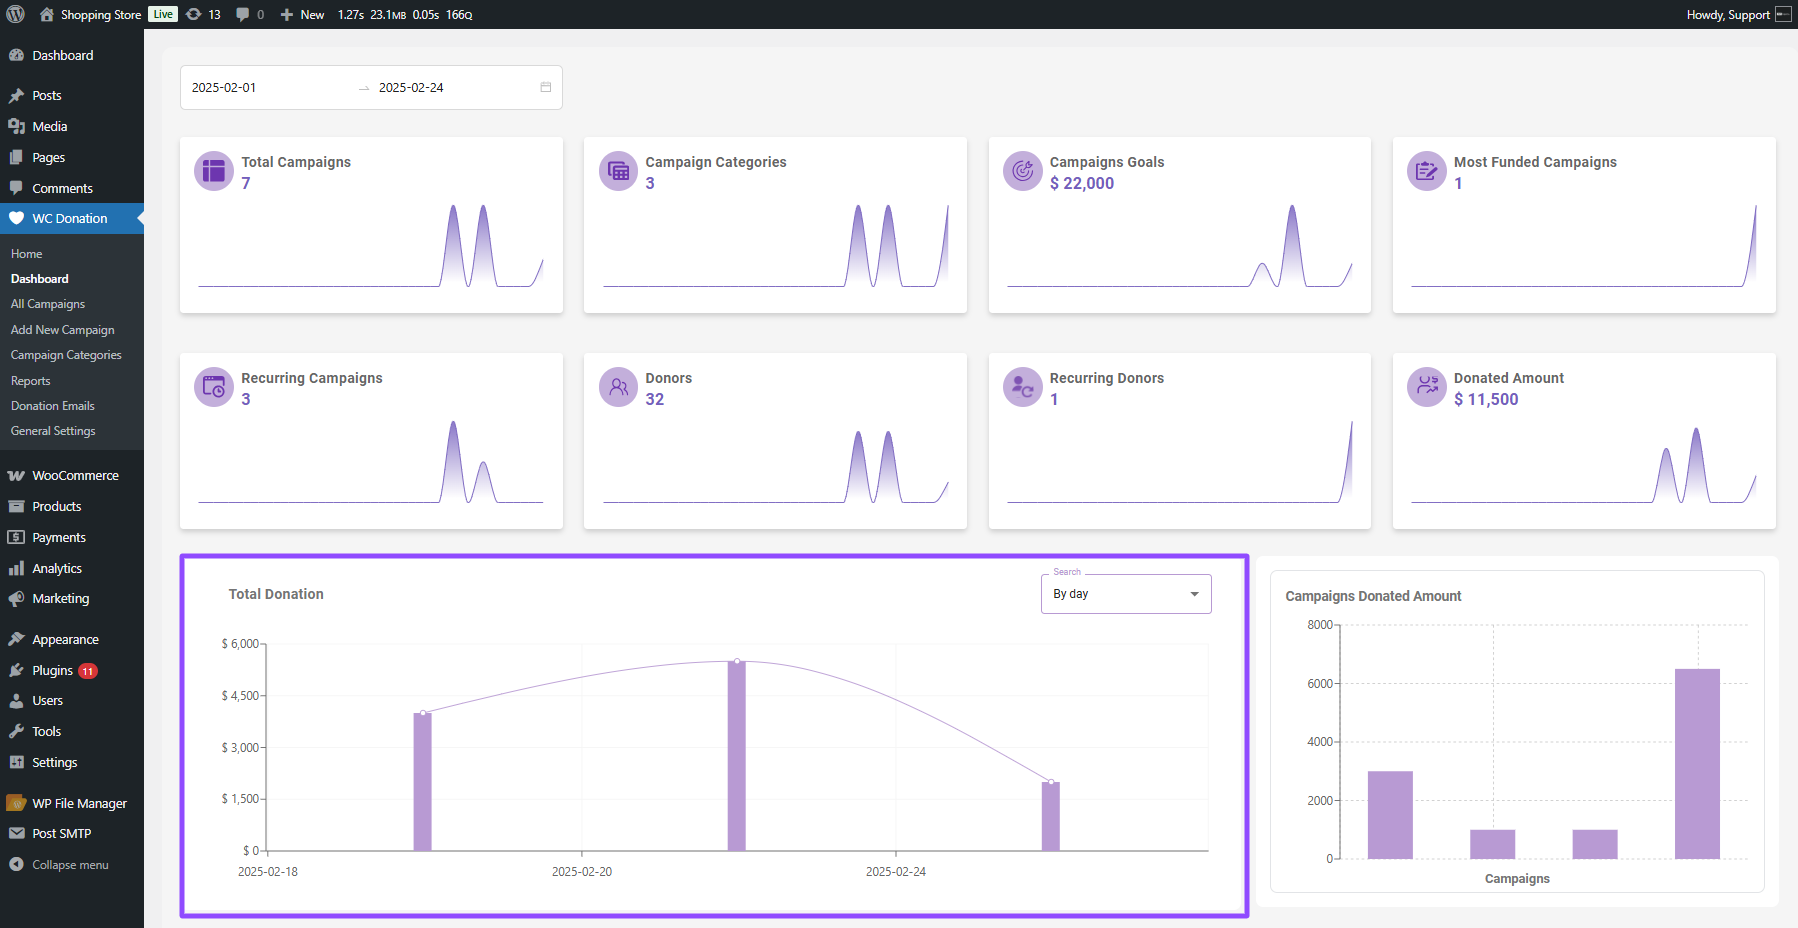
This is where trends reveal themselves. Perhaps you notice a surge every Friday. Or donations dwindle on weekends. Or that social media blitz on the 15th actually had an impact.
You can hover over any bar to view the actual figures for that time. And there are sub-filters within the graph itself, so you can toggle between looking at things by day or by week without having to leave the page.
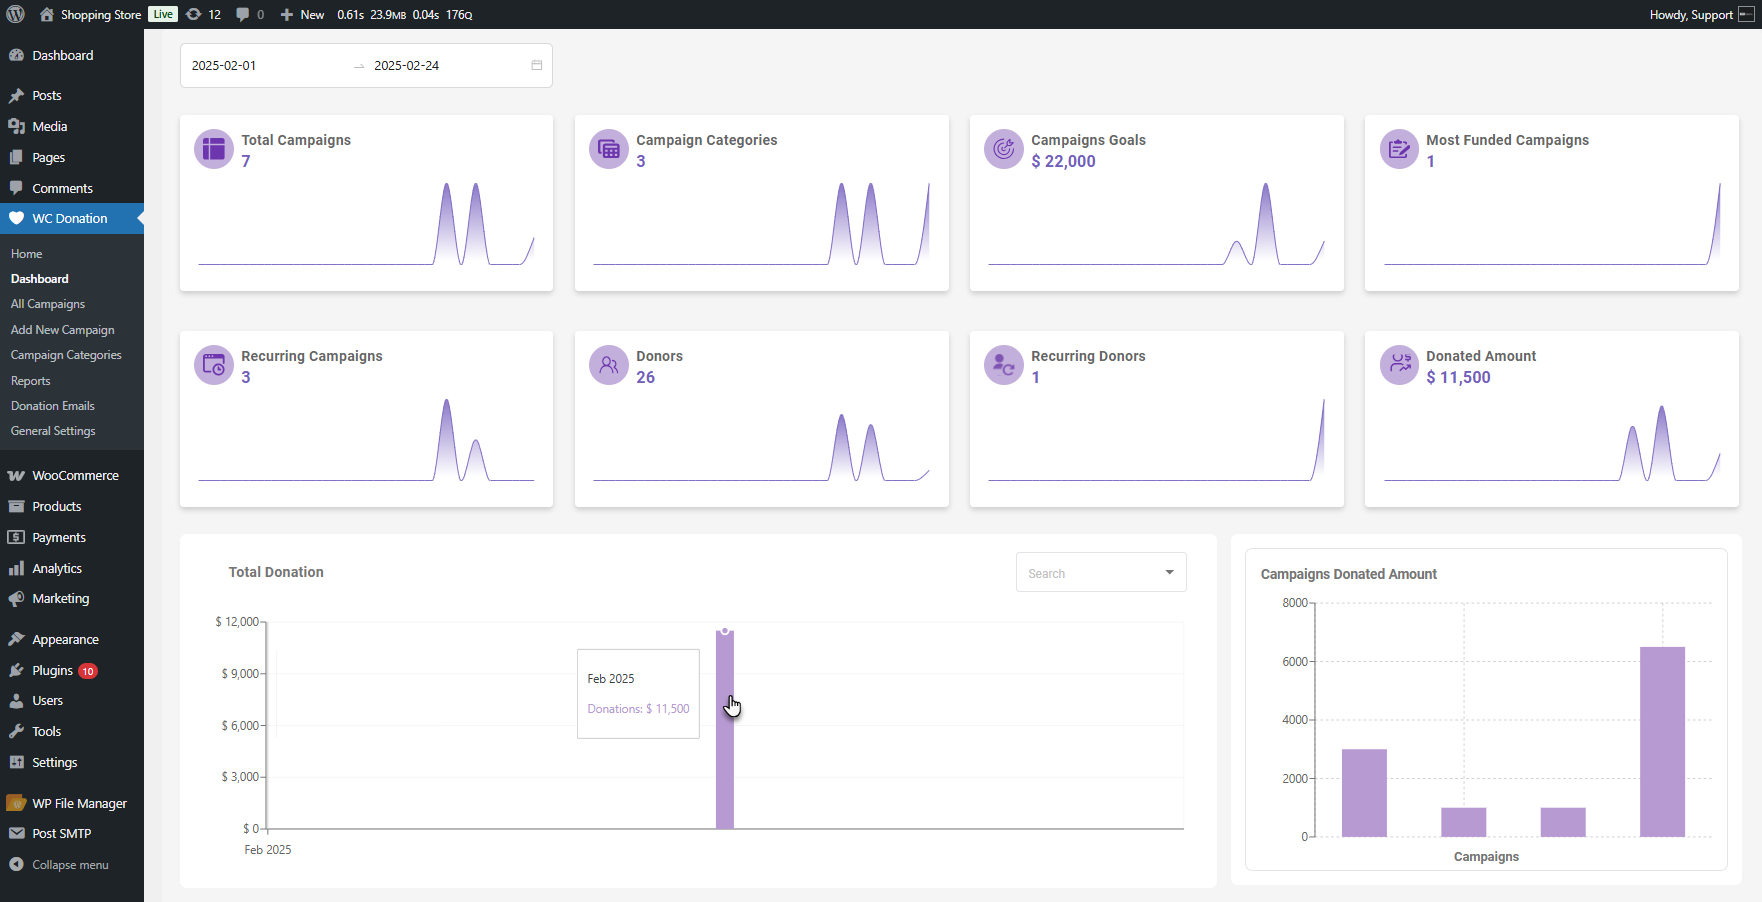
The graph resizes to whatever filter you select. It’s responsive like that.
Comparing Campaigns Side by Side
The third shows a bar chart of donation totals per campaign. Each campaign has one, sized proportionally.
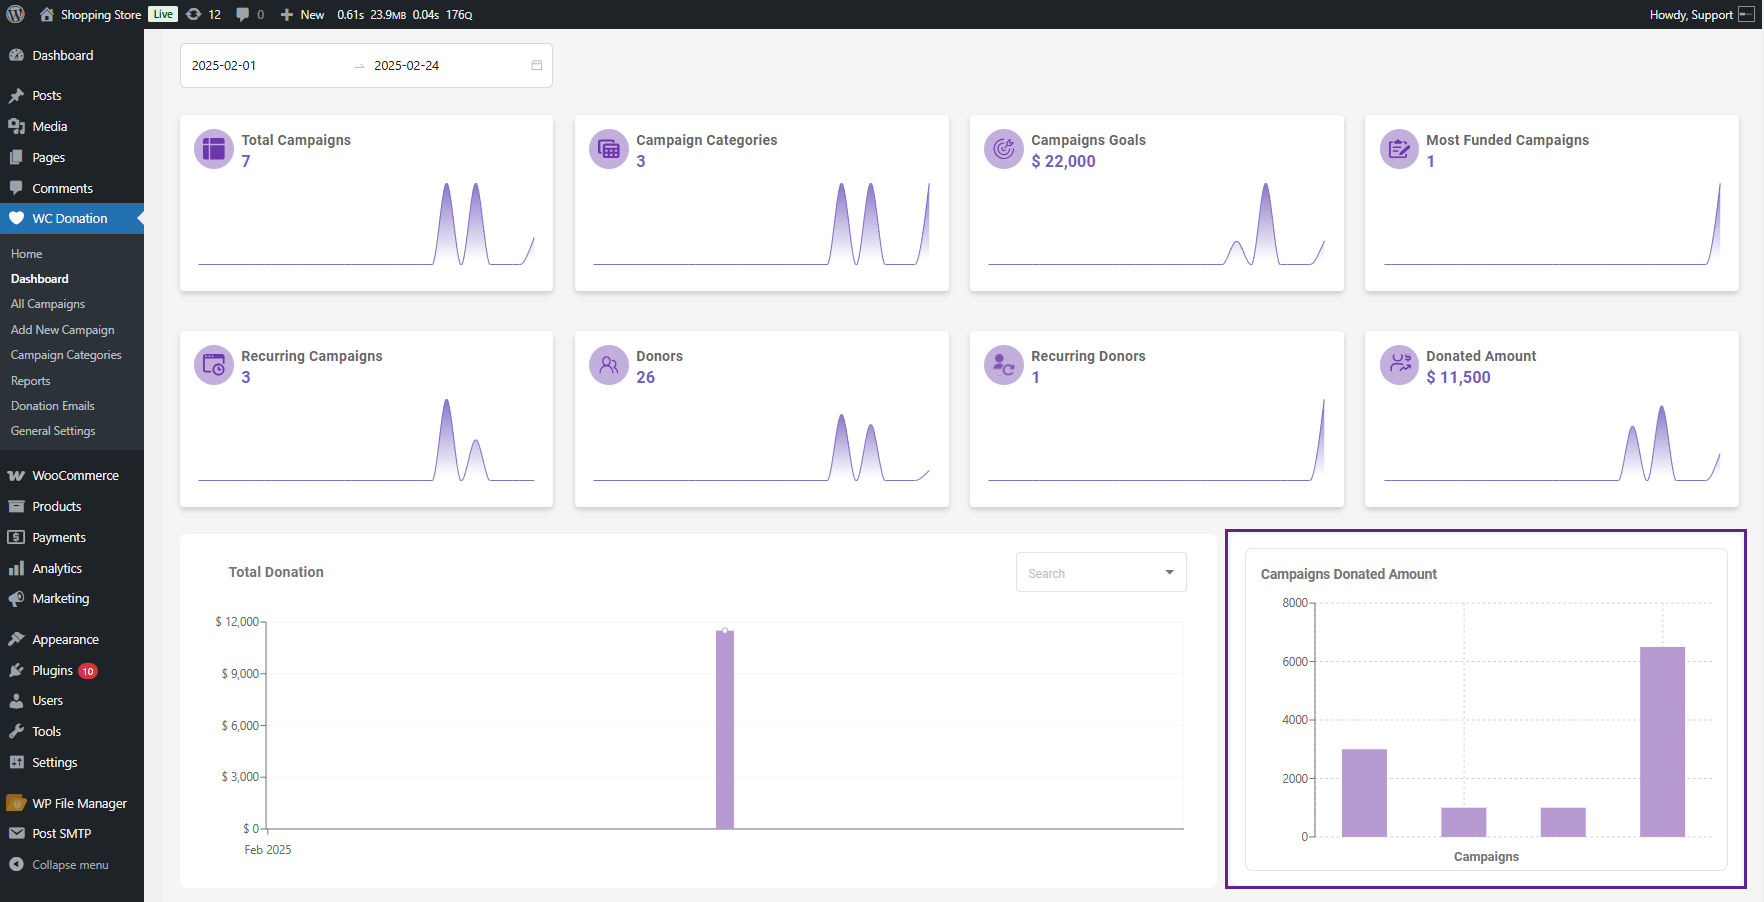
This perspective answers a question that’s more difficult to determine otherwise: which campaigns are succeeding?
If you hover over a bar, you get two numbers—the amount donated and the initial goal. So you know at a glance whether a campaign is breaking out or faltering.
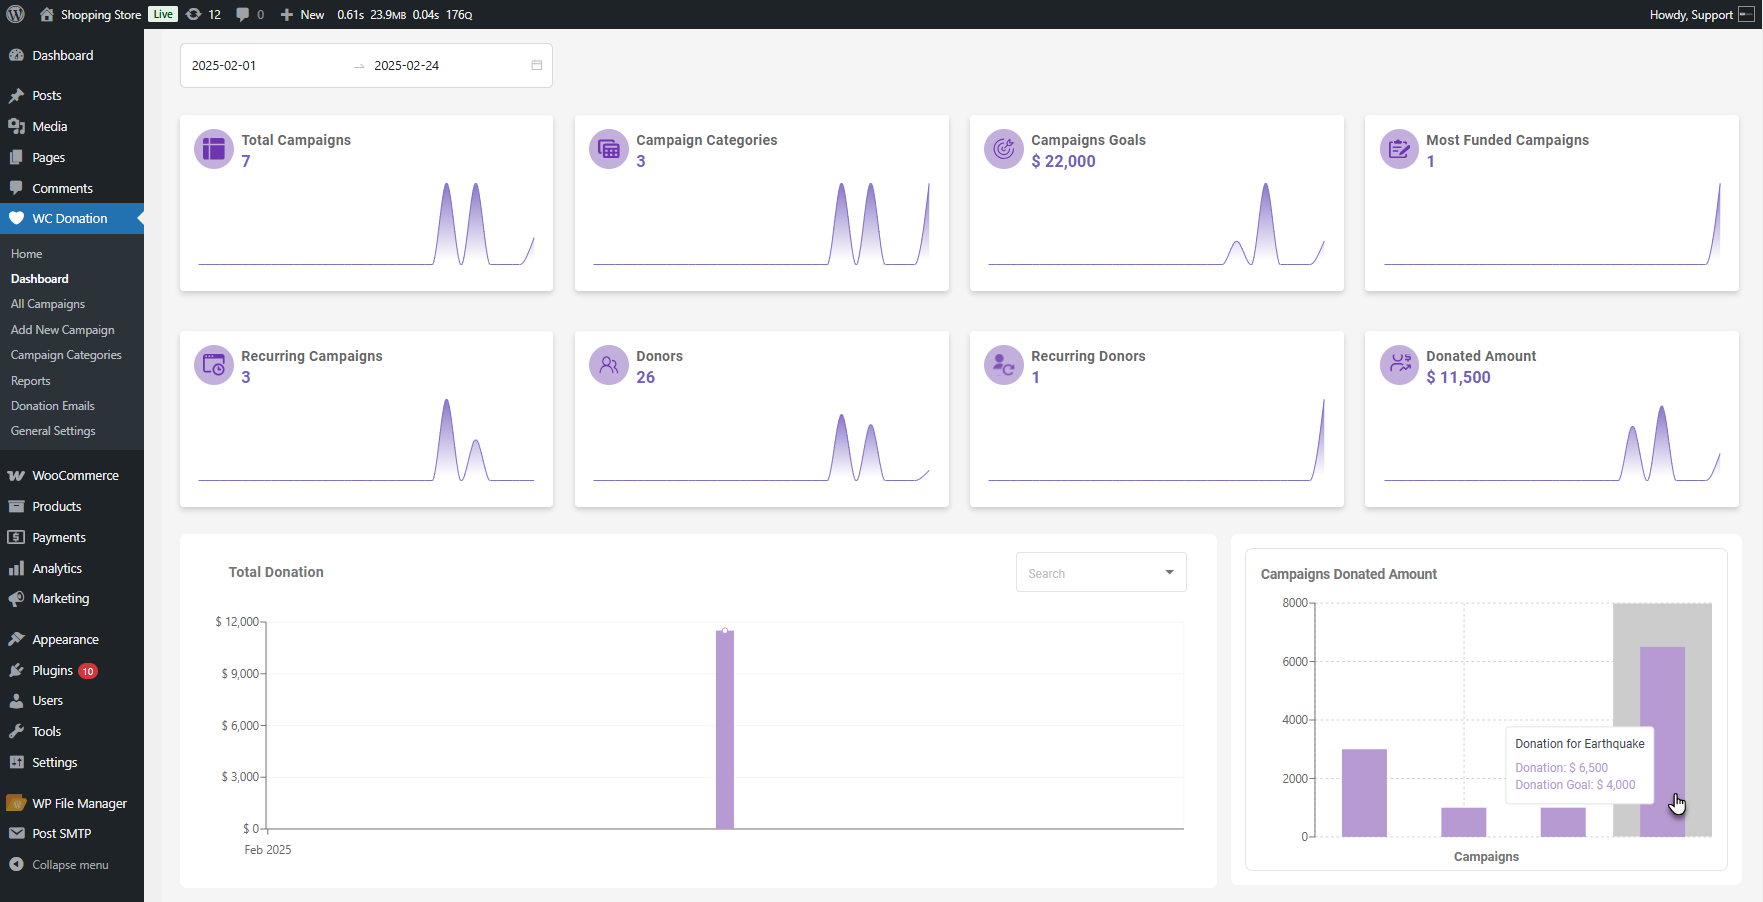
Sometimes the outcomes are unexpected. The campaign you expected to be doing well may be falling behind, while another one you hardly promoted is quietly thriving. These comparisons are made clear by this chart.
The Details Table: Where You Drill Down Into Details
The fourth part is a table where you have all your campaign details in rows and columns.
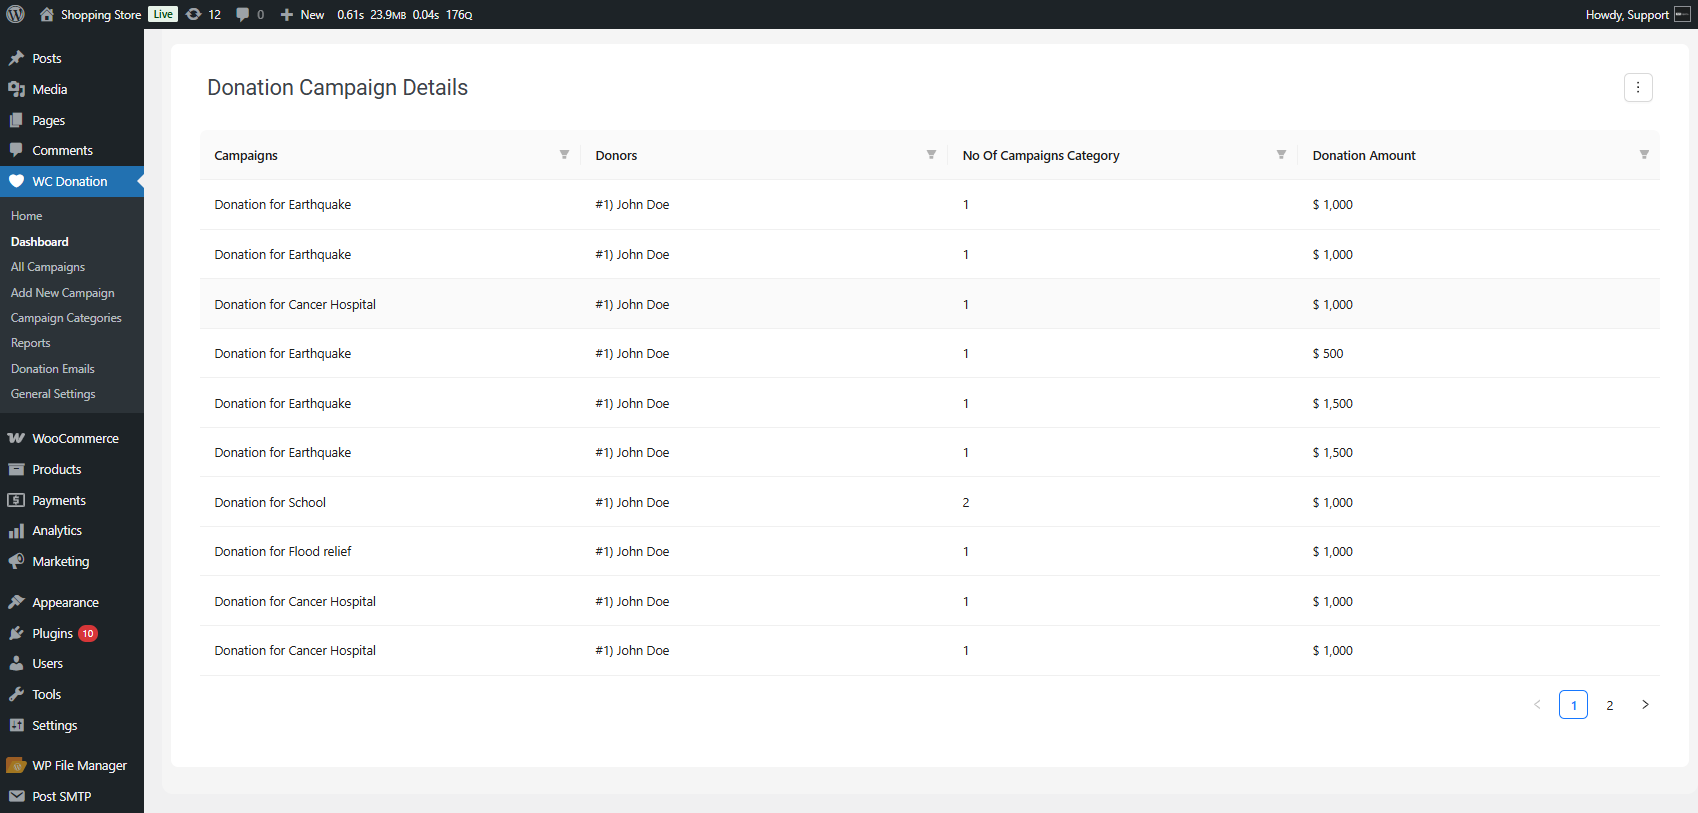
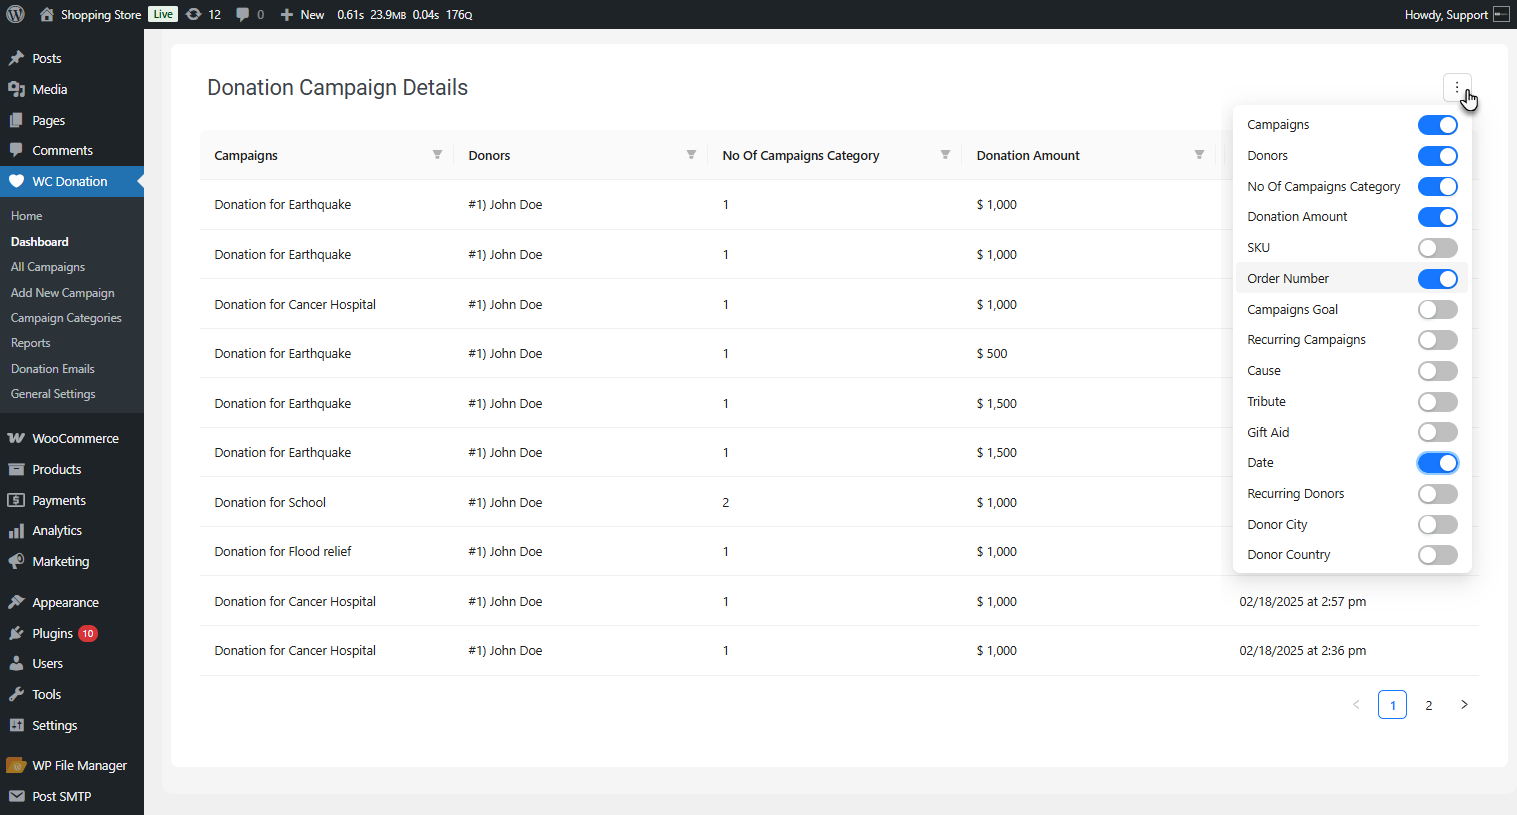
It defaults to showing four columns of the most essential information. However, you can display additional columns if you require them. Each organization measures things slightly differently, so the flexibility is helpful.
Here’s the time-saver part: each column has its own filter. You can sort any column as you want. You can search in it and filter for specific values. Need campaigns in a particular category? Piece of cake.
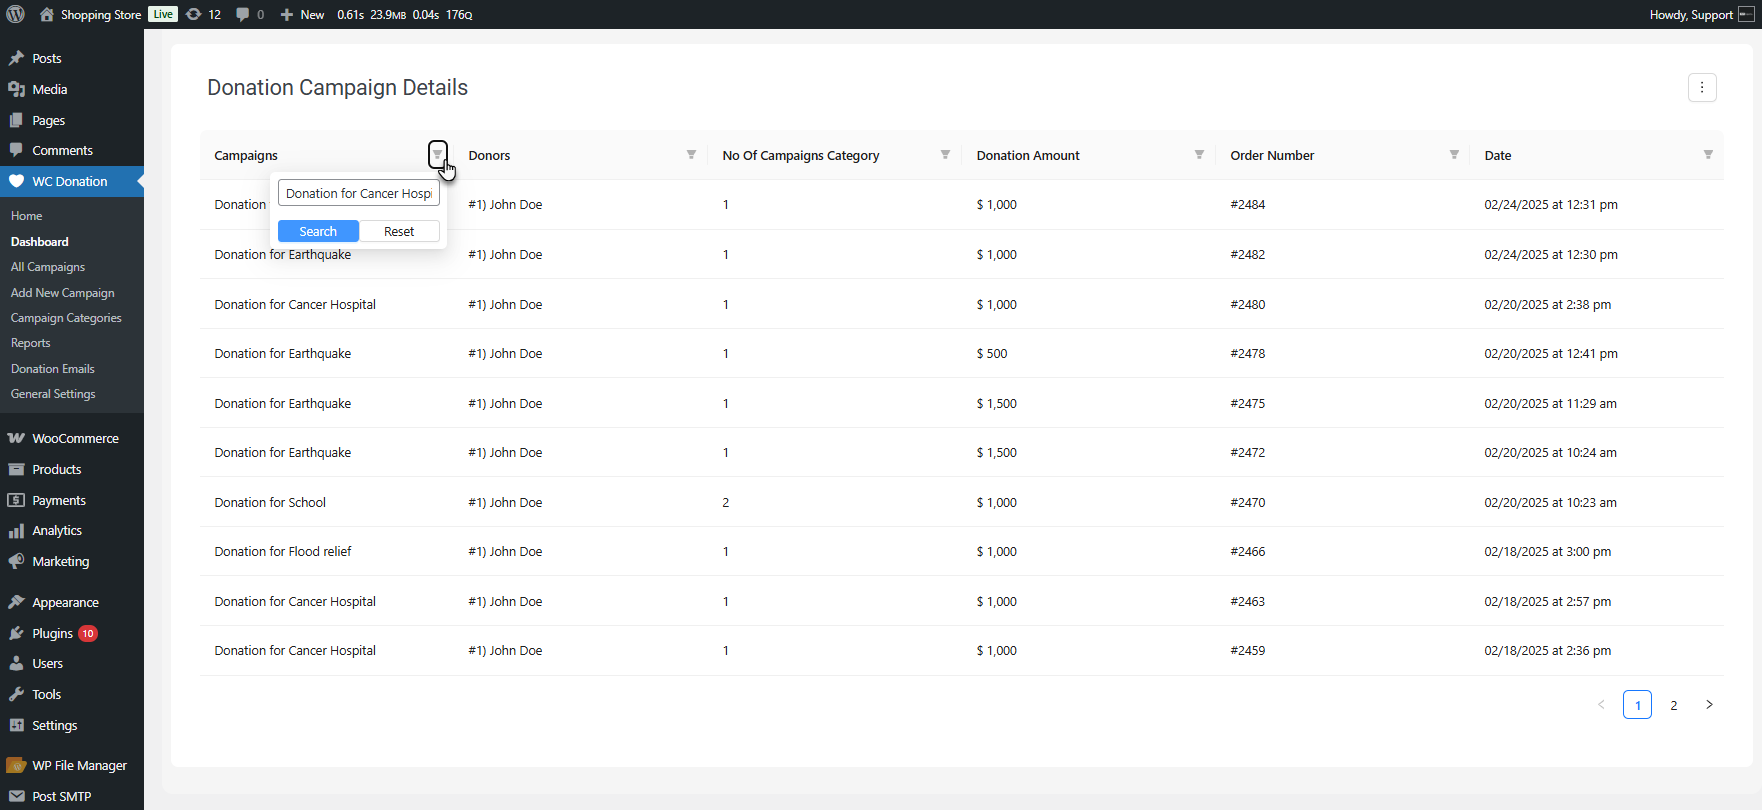
This table is where you look when someone asks you a specific question, and you need to answer quickly. It’s searchable, sortable, and you can look at it however makes sense for what you’re trying to solve.
[product_banner index=’1′]
Why Donation Dashboard Matters More Than You’d Think
Mostly, we have seen people who think that the dashboard is not the most exciting part of the add-ons. But in fundraising reality, it eliminates the obstacles between you and your donation data.
From Effort to Instant Insights: The Power of the Dashboard
Previously, gaining insights required effort, like exporting CSVs. Creating reports. Having your developer extract numbers. Waiting.
Today, you can simply open the dashboard thanks to the Donation for WooCommerce add-on by WPExperts. The insights are present. You can make decisions based on what is really occurring, not what you recollect or speculate.
Real-Time Campaign Monitoring: Identify Issues Early and Pivot
Donation dashboard alters the way you campaign. You’re able to identify issues early on. If a campaign isn’t going well two weeks in, you notice it and can redirect your strategy. And if you notice your donation campaign is performing better than expected, you can put more effort into it.
Making Data-Driven Decisions: Confidently Addressing Stakeholders
With clear and visible data visualization on the dashboard, you can now respond truthfully when board members or donors inquire. “How are we doing?” is no longer a general question. You’ve got numbers, trends, comparisons—real proof of what’s going on.
Standout Donation Dashboard Features that Make Small Things Better
– Unified Date Range Filter
The date range filter applies across the whole dashboard. You update the date once, and the entire donation data updates instantly.
– Hover-Over Data
Hover-over data on charts and graphs helps you avoid blinking at axis labels or guessing exact values. Click on something, then glance at the numbers.
– Customizable Timeline
Being able to view the donation timeline in a day or a week allows you to choose how much detail you wish to provide. Sometimes you want the big picture. Sometimes you want to know what occurred last Tuesday.
– Tracking Return Donors
The return donors metric, in the summary boxes, keeps the all-important audience at the front and center. It’s easy to forget about the returning donors and only consider the new donors.
Problems that the Donation Dashboard Feature Solves for You
| Without Any Donation Dashboard | With Donation for WooCommerce Dashboard |
|---|---|
| Export data to spreadsheets | View everything instantly |
| Calculate totals manually | Auto-updated numbers |
| Guess which campaigns work | See performance rankings |
| Wait for developer help | Self-serve your answers |
| Prepare reports for meetings | Show live data directly |
| Miss early warning signs | Catch problems immediately |
| Track only donation totals | Monitor 8 different metrics |
| Search through transaction logs | Filter campaigns in one click |
Getting Started with the Donation Dashboard is Simple
This feature-rich dashboard comes with the Donation for WooCommerce extension.
[product_banner index=’1′]
Once you have the add-on installed, it’s just sitting there in your WordPress admin under WC Donation.
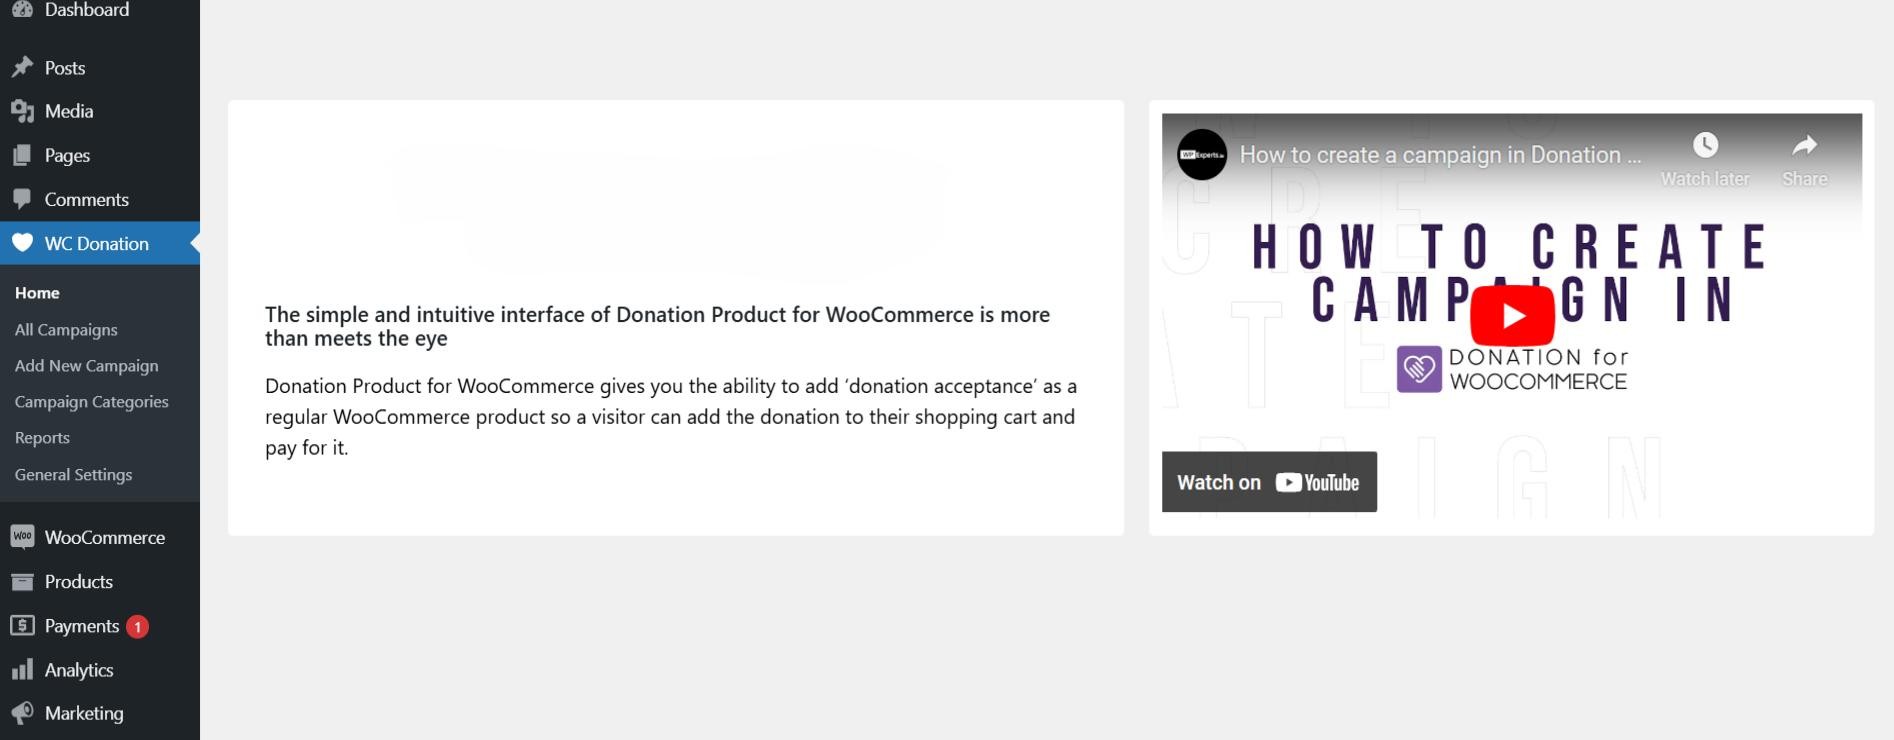
There’s very little to configure. It pulls from your existing donation data and lays it out for you. The date range is defaulting to something sensible, and you can edit it whenever you like.
The interface is not complicated. If you can handle WordPress, then you can handle this dashboard. There isn’t a learning curve in which you’ll need training or documentation diving.
If something still confuses you or you get stuck, you can contact our WooCommerce support team for help. You can also direct to the technical documentation of Donation for WooCommerce.
Wrapping Up
Before reading this blog, you might have found fundraising hard. You need to work harder to understand what’s working, what’s not, and where to focus your energy. The new Donation for WooCommerce Dashboard simplifies your work and provides clarity.
It’s not going to automate your campaigns for you. But it will inform you so you can make better decisions about how to run them. And honestly, that’s what the majority are going to need. Not additional bells and whistles. Just clarity.
If you’re already a user of Donation for WooCommerce, the dashboard is waiting for you. If you’re not, and you’ve had enough guessing what’s happening with your fundraising campaigns, it’s time to take a look.
Because at the end of the day, you can’t repair what you can’t see. And now you can see it all.
Install Donation for WooCommerce now and gain those valuable insights you’ve always craved for through the intuitive dashboard.
[product_banner index=’1′]


